| Info |
|---|
Treść tego dokumentu jest pisana z myślą o osobach, które mają już podstawowe pojęcie o działaniu i możliwościach Google Analytics. Osoby, które nie znają tego narzędzia powinny w pierwszej kolejności zapoznać się z materiałami dostępnymi bezpłatnie w Akademii Analytics prowadzonej przez Google. |
Spis treści
| Table of Contents |
|---|
Instalacja kodu śledzącego Google Analytics
Aby rozpocząć korzystanie z Google Analytics (dalej: GA), należy w pierwszej kolejności zainstalować kod śledzący GA w stronach generowanych przez Aplikację Czytelnika. Kod taki jest już domyślnie osadzony w szablonach strona Aplikacji Czytelnika, należy jednak podać tzw. Identyfikator śledzenia. Identyfikator ten dostępny jest w panelu administracyjnym Google Analytics, w sekcji Usługa / Informacje o śledzeniu / Kod śledzenia i ma postać UA-<ciąg liczb>-<ciąg liczb>, na przykład:
The content of that document is written for people who already have some knowledge about the functioning and possibilities of Google Analytics. Readers who do not know that tool should first become acquainted with the free materials published in the Google Analytics Academy. |
Contents
| Table of Contents |
|---|
Installing the Google Analytics Tracking Code
In order to use Google Analytics (hereinafter called GA), the user should first install the GA tracking code on the pages generated by the reader application. By default, the code is embedded in the templates of the pages of the reader application, but the so-called tracking identifier should be given. The identifier is available in the Google Analytics administration panel, in the “Service > Tracking information > Tracking code” section, and it has the following form: UA-<number sequence>-<number sequence>, for example:
Once the code has been copied from Google Analytics pages, it should be placed in the WEB-INF/components/templates/AnalyticsComponent.vm file as the Po skopiowaniu tego kodu ze stron Google Analytics należy go umieścić w pliku konfiguracyjnym . ................ jako wartość parametru konfiguracyjnego .................. Po zapisaniu zmian w pliku konfiguracyjnym i zrestartowaniu Aplikacji Czytelnika, kod śledzący powinien być już poprawnie osadzany. Efektem tego będzie zarówno widoczność kodu śledzącego w kodzie HTML stron WWW Aplikacji Czytelnika, jak i rozpoczęcia raportowania danych do GA.
Zaawansowana konfiguracja Google Analytics
Poza opisanym powyżej zainstalowaniem kodu śledzącego zalecane jest również skonfigurowanie zaawansowanych funkcji Google Analytics. Najistotniejsze zaawansowane ustawienia opisano poniżej.
Usunięcie nieistotnych parametrów z adresów WWW
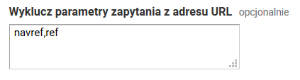
Konfigurowanie usunięcia z danych analitycznych nieistotnych w tym kontekście parametrów z adresów WWW możliwe jest w opcjach administracyjnych GA, w sekcji Widok danych, w Ustawieniach widoku. Należy tam wpisać w pole Wyklucz parametry zapytania z adresu URL wartość: navref,ref
Konfiguracja śledzenia wyszukiwania wewnątrz biblioteki cyfrowej
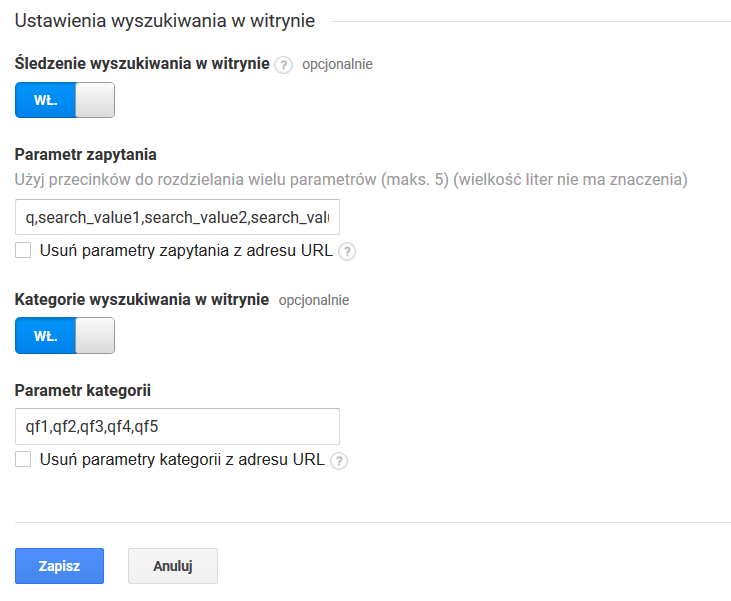
Konfigurowanie śledzenia wyszukiwania wewnątrz biblioteki cyfrowej możliwe jest w opcjach administracyjnych GA, w sekcji Widok danych, w Ustawieniach widoku. Należy tam włączyć (patrz zrzut ekranu poniżej) Śledzenie wyszukiwania w witrynie, a także włączyć Kategorie wyszukiwania w witrynie oraz wpisać:
configuration parameter value. The tracking code should be embedded correctly after the changes have been saved in the configuration file and after the reader application has been restarted. As a result, the tracking code will be visible in the HTML code of the web pages of the reader application, and data will be reported to GA.
Advanced Google Analytics Configuration
Apart from the installation of the tracking code, configuring advanced Google Analytics functions is also recommended. The most important advanced settings are described below.
Removing the Unnecessary Parameters from Website Addresses
A removal of unnecessary, in a given context, parameters from web addresses can be configured in the administrative options of GA, in the “View” section, in the “View settings” option, in the “Exclude URL query parameters” – value “navref,ref” should be entered there.
Configuring the Search Tracking inside the Digital Library
Search tracking inside the digital library can be configured in the administrative options of Google Analytics, in the “View” section, in the “View settings” option. The user should enable “Site search tracking” option and the “Search categories” there and enter:
- the “qW pole Parametr zapytania ciąg: q,search_value1,q,search_value2,q,search_value3,q,search_value4 - spowoduje to śledzenie zapytań prostych oraz zapytań zaawansowanych (pierwszych czterech elementów składowych).W pole Parametr kategorii ciąg: qf1value4” sequence in the “Parameter” field– as a result, simple and advanced queries (the first four constituents) will be tracked; and
- the “qf1,qf2,qf3,qf4,qf5 - spowoduje to śledzenie do pięciu równoczesnych filtrów wyszukiwania stosowanych przez użytkowników.
Raporty z wyszukiwania w witrynie można znaleźć w części analitycznej GA, w sekcji ZACHOWANIE / Wyszukiwane hasła.
Konfiguracja celów
Cele w GA służą do monitorowania tego, w jakiej liczbie sesji użytkowników ma miejsce określone, istotne z naszego punktu widzenia, działanie. W przypadku sklepu internetowego takim działaniem może być dodanie przedmiotu do koszyka, dokonanie zakupu czy wysłanie formularza kontaktowego. W kontekście biblioteki cyfrowej proponujemy zdefiniowanie szeregu celów opisanych poniżej.
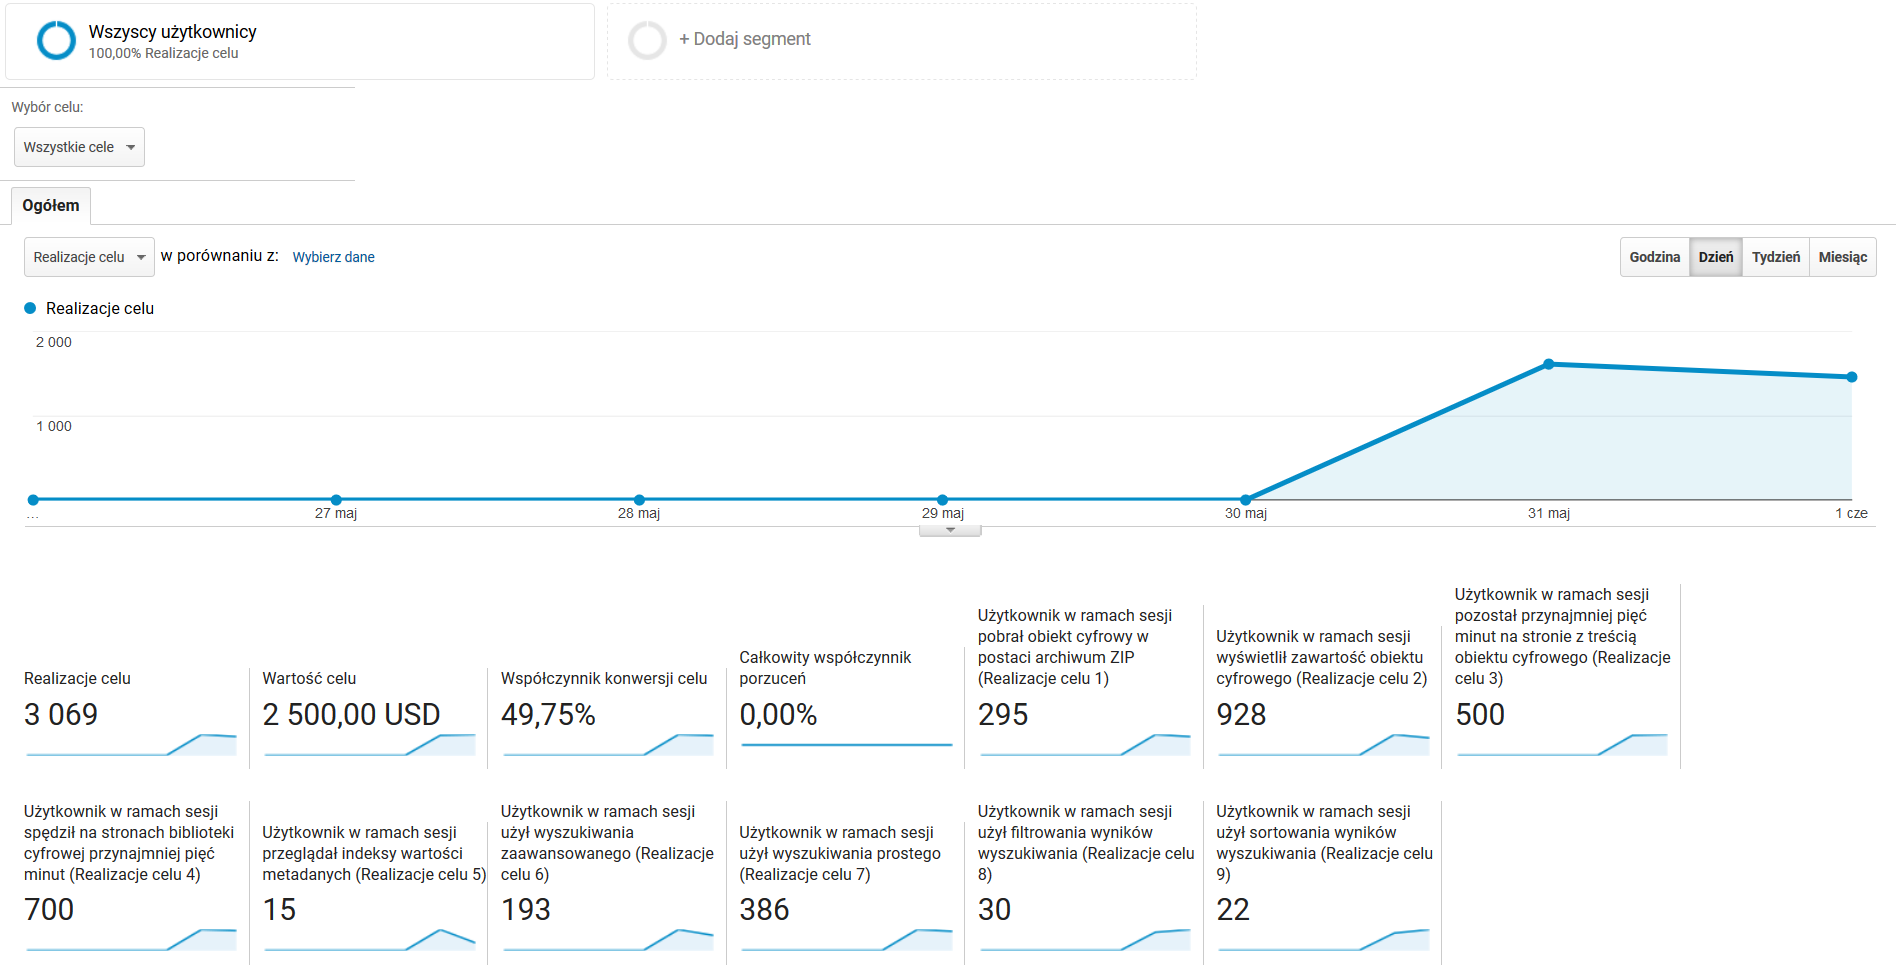
Cele definiuje się w części administracyjnej GA, w sekcji Widok danych / Cele. Po zdefiniowaniu celów rozpoczyna się w GA gromadzenie danych niezbędnych do wyświetlana statystyk dotyczących celów. Po dniu czy dwóch od zdefiniowania celów pierwsze efekty można sprawdzić w GA w części analitycznej, w sekcji KONWERSJE / Cele / Przegląd.
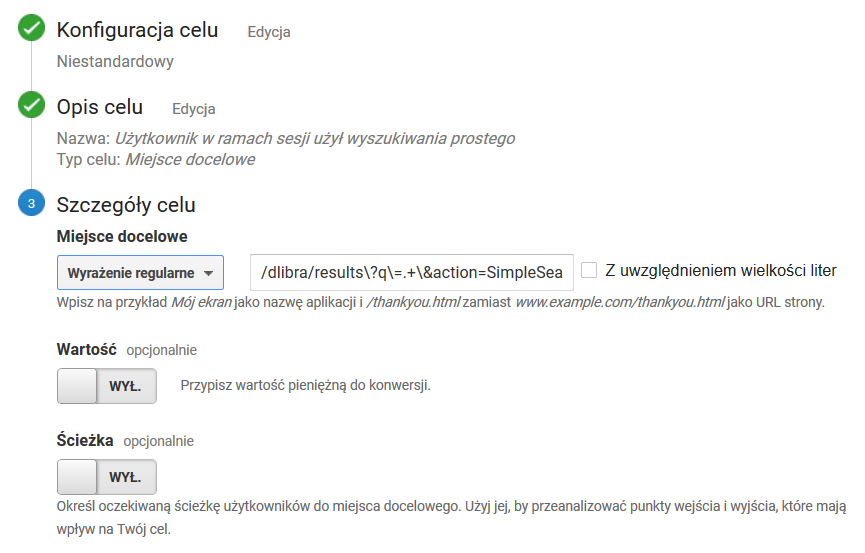
Użytkownik w ramach sesji użył wyszukiwania prostego
- qf5” sequence in the “Parameter” field – as a result, up to five search filters used by users will be tracked at once.
Site search reports can be found in the analytical part of GA, in the “Behavior > Search terms”
Configuring Goals
In GA, goals are for tracking the number of user sessions in which a particular action – which is important from our point of view – is undertaken. In the case of an online store, the action could be adding a product to the cart, making a purchase, or sending a contact form. For a digital library, we suggest defining a series of goals described below.
The goals are defined in the administrative part of GA, in the “View > Goals" section. Once the goals have been defined, the data necessary for displaying statistics related to goals are collected in GA. The first effects of that can be checked in the analytical part of GA, in the “Conversions > Goals > Overview” section, after a day or two.
The User Has Used the Simple Search during the Session
Goal settings as in the screenshot below. The value of the regular expression: Ustawienia celu jak na zrzucie ekranu poniżej. Wartość wyrażenia regularnego: /dlibra/results\?q\=.+\&action=SimpleSearchAction\&.+
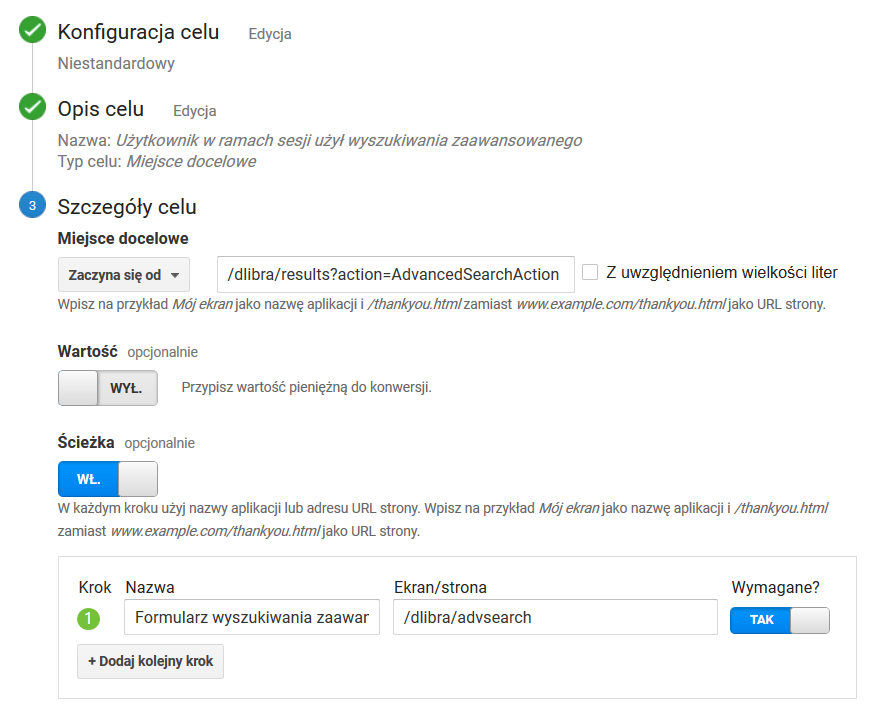
Użytkownik w ramach sesji użył wyszukiwania zaawansowanego
Ustawienia celu takie jak na zrzucie ekranu poniżej. Wartości poszczególnych pól:
The User Has Used the Advanced Search during the Session
Goal settings as in the screenshot below. The values of particular fields:
- the value in the “Begins with” fieldWartość w polu "Zaczyna się od": /dlibra/results?action=AdvancedSearchAction
- Przełącznik "Ścieżka": WŁ.
- the “Path” switch: ON
- the value in the “Step 1” section:
- name: advanced search form
- screen/page
- Nazwa: Formularz wyszukiwania zaawansowanego
- Ekran/strona: /dlibra/advsearch
- Wymaganerequired: TAKYES
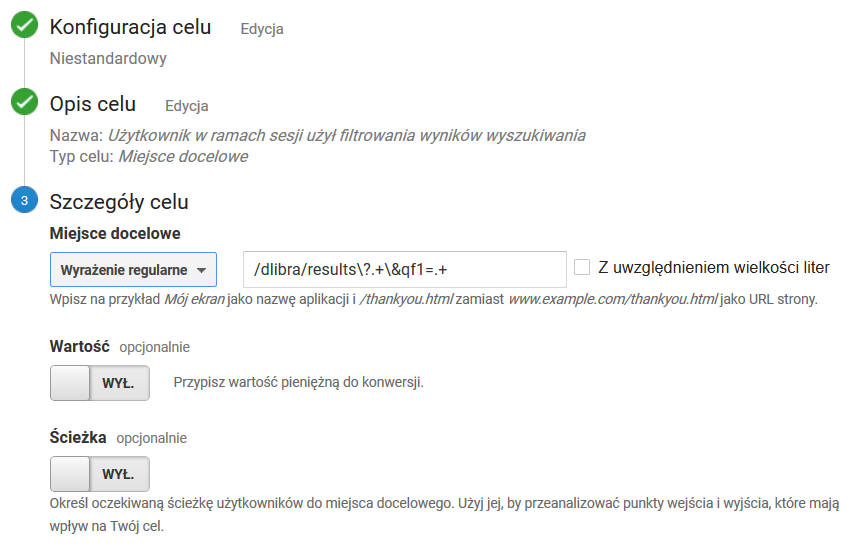
Użytkownik w ramach sesji użył filtrowania wyników wyszukiwania
The User Has Used Search Result Filtering during the Session
Goal settings as in the screenshot below. The value of the regular expression: Ustawienia celu jak na zrzucie ekranu poniżej. Wartość wyrażenia regularnego: /dlibra/results\?.+\&qf1=.+
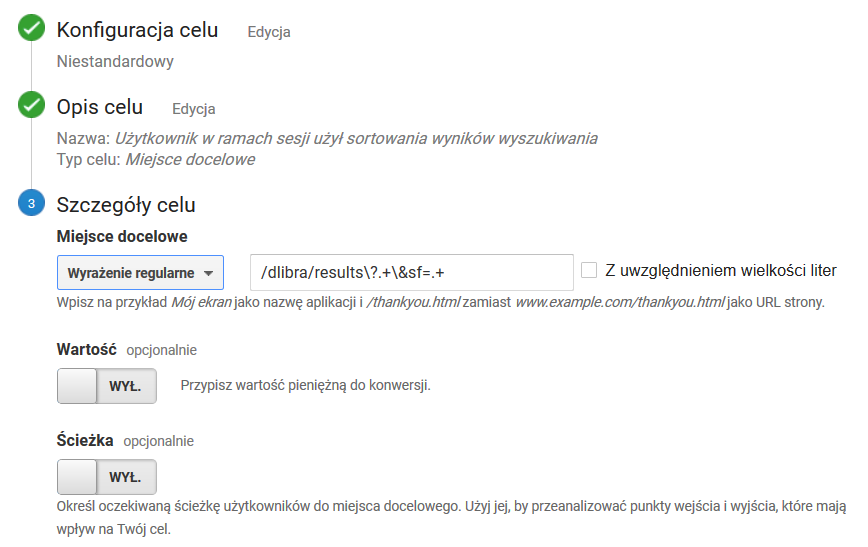
Użytkownik w ramach sesji użył sortowania wyników wyszukiwania
The User Has Used Search Result Sorting during the Session
Goal settings as in the screenshot below. The value of the regular expressionUstawienia celu jak na zrzucie ekranu poniżej. Wartość wyrażenia regularnego: /dlibra/results\?.+\&sf=.+
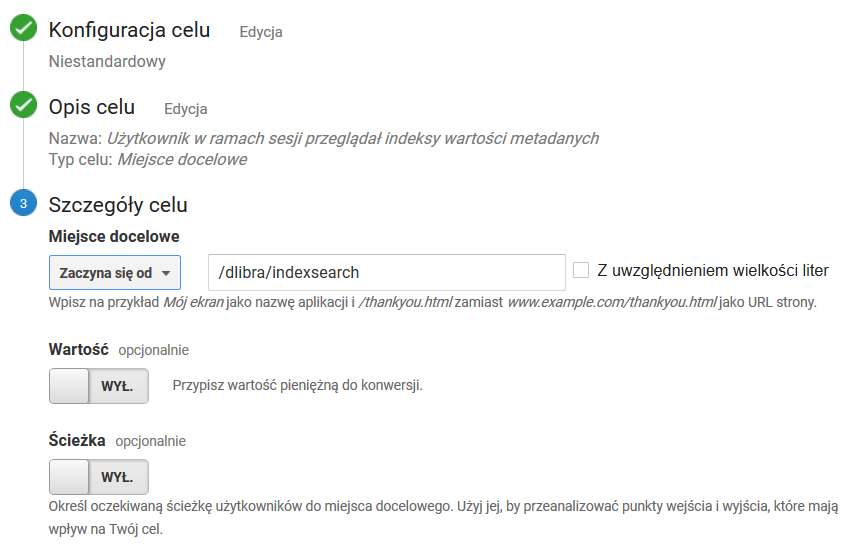
Użytkownik w ramach sesji przeglądał indeksy wartości metadanych
The User Has Browsed Metadata Value Indexes during the Session
Goal settings as in the screenshot below. The value in the “Begins with” fieldUstawienia celu takie jak na zrzucie ekranu poniżej. Wartość w polu Zaczyna się od: /dlibra/indexsearch
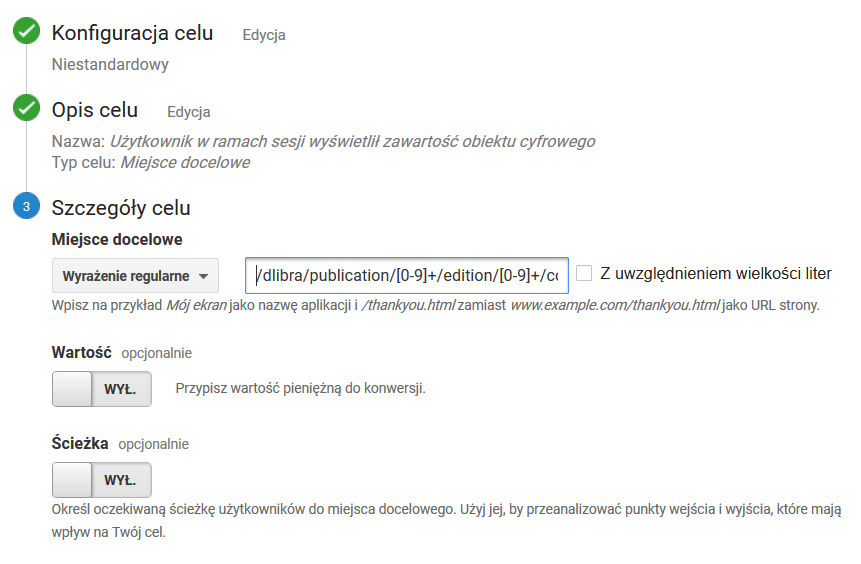
Użytkownik w ramach sesji wyświetlił zawartość obiektu cyfrowego
The User Has Displayed the Content of a Digital Object during the Session
Goal settings as in the screenshot below. The value of the regular expressionUstawienia celu jak na zrzucie ekranu poniżej. Wartość wyrażenia regularnego: /dlibra/publication/[0-9]+/edition/[0-9]+/content.*
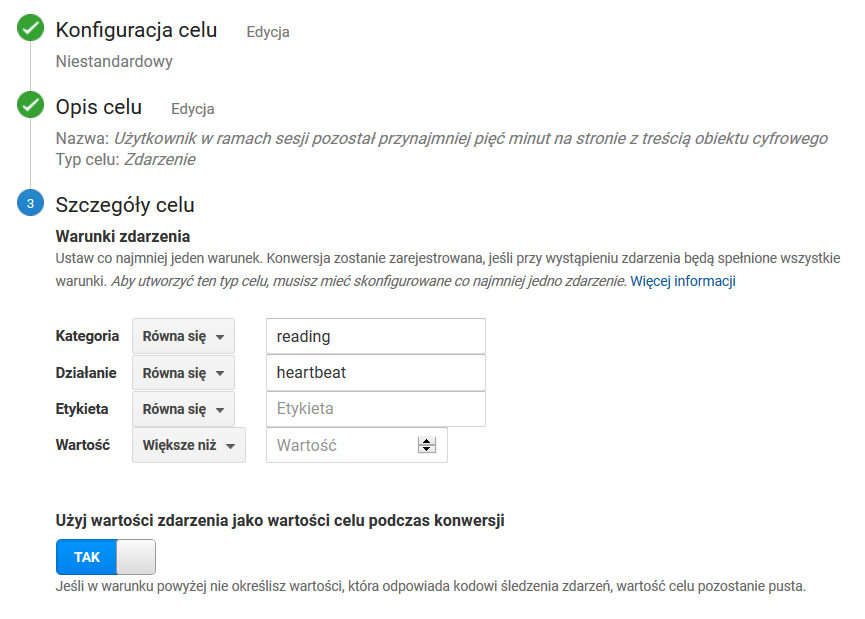
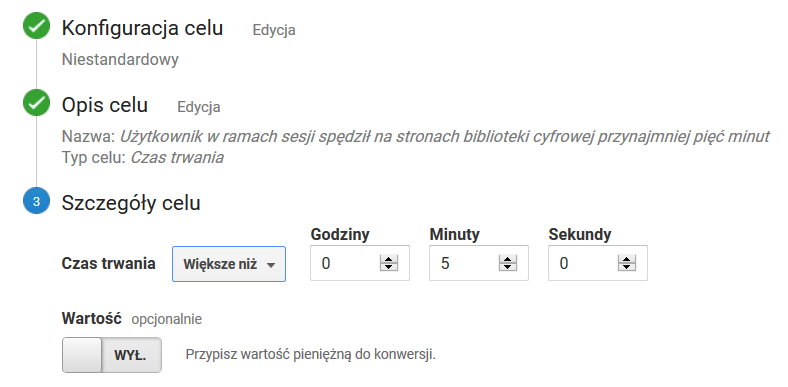
Użytkownik w ramach sesji pozostał przynajmniej pięć minut na stronie z treścią obiektu cyfrowego
Ustawienia celu jak na zrzucie ekranu poniżej. Wartości poszczególnych pól:
- Kategoria: reading
- Działanie: heartbeat
- Etykieta: pozostaje puste
- Wartość: pozostaje puste
- Użyj wartości zdarzenia jako wartości celu podczas konwersji: TAK
Monitorowanie czasu spędzonego na stronie z treścią obiektu cyfrowego jest realizowane poprzez dedykowane skrypty raportujące wbudowane w kod systemu dLibra, w stronę na której prezentowana jest treść obiektu. Skrypty te powodują, że gdy strona jest otwarta, co 5 minut do GA wysyłane jest zdarzenie (opisane jako [kategoria: reading, działanie: hearbeat]). Dzięki temu możliwe jest monitorowanie czasu jaki użytkownik spędza na interakcji z treścią obiektu (np. przegląda plik PDF). Interakcja taka, bez dodatkowego wsparcia po stronie systemu biblioteki cyfrowej, wymyka się skryptom śledzącym GA, powodując też znaczne zaniżanie pomiarów czasu trwania sesji użytkowników.
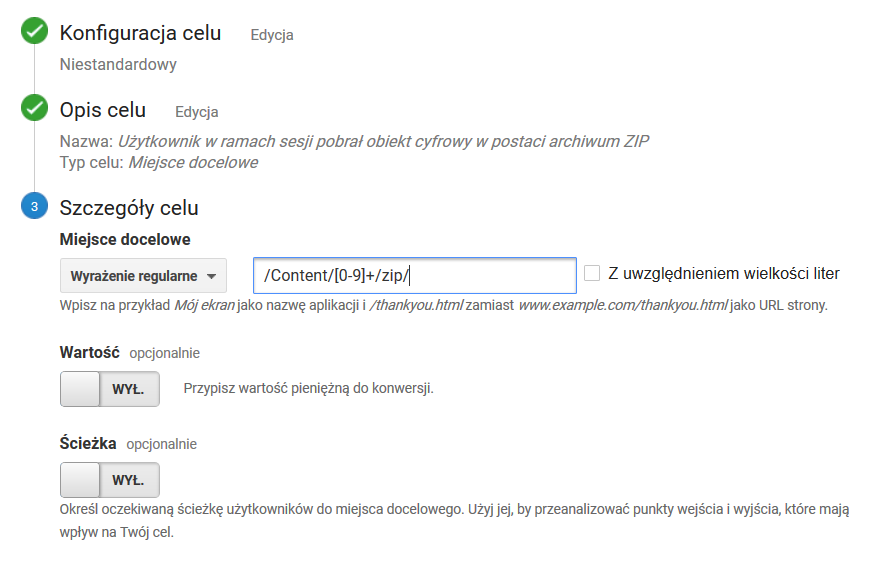
Użytkownik w ramach sesji pobrał obiekt cyfrowy w postaci archiwum ZIP
The User Has Remained for at Least Five Minutes on the Page with the Content of a Digital Object
Goal settings as in the screenshot below. The values of particular fields:
- category: reading
- action: heartbeat
- label: remains empty
- value: remains empty
- Use the action value as the goal value during conversion: YES
The time spent on a page with the content of a digital object is tracked by dedicated reporting scripts built into the code of the dLibra system, in the page on which the content of the object is presented. When the page is open, an event is sent to GA every 5 minutes (it is described as [category: reading, action: heartbeat]), so the period of time during which the user interacts with the content of the object (for example, browses a PDF file) can be tracked. Without additional support on the part of the system of the digital library, such an interaction is not caught by the GA tracking scripts, which results in significant underestimation of user session times.
The User Has Downloaded a Digital Object in the Form of a ZIP Archive during the Session
Goal settings as in the screenshot below. The value of the regular expressionUstawienia celu jak na zrzucie ekranu poniżej. Wartość wyrażenia regularnego: /Content/[0-9]+/zip/
Użytkownik w ramach sesji spędził na stronie WWW biblioteki cyfrowej łącznie przynajmniej pięć minut
Ustawienia celu jak na zrzucie ekranu poniżej.
Przykłady analizy danych
Poniżej przedstawiono przykłady analizy danych dotyczących ruchu użytkowników w bibliotece cyfrowej. Przykłady te absolutnie nie wyczerpują możliwości GA, jednak zostały dobrane w taki sposób, aby zwrócić uwagę na wybrane możliwości GA, ciekawe w kontekście bibliotek cyfrowych.
Popularność obiektów - liczba wyświetleń strony z metadanymi i wyświetleń on-line
- Wybrać raport: ZACHOWANIE / Analiza treści
- W tabeli, w kolumnie "Poziom 1 ścieżki strony" kliknąć /dlibra/
- W tabeli, w kolumnie "Poziom 2 ścieżki strony" kliknąć /publication/
- Widoczna jest tabela z identyfikatorami publikacji, posortowana domyślnie wg liczby odsłon, malejąco. Odsłona to w tym kontekście to:
- Dla publikacji z treścią: wyświetlenie strony z metadanymi lub wyświetlenie treści on-line.
- Dla publikacji bez treści (np. wyższego rzędu elementów publikacji grupowych - np. całe czasopismo): wyświetlenie strony z opisem/strukturą danego elementu publikacji grupowej.
- Kliknięcie w identyfikator publikacji w kolumnie "Poziom 3 ścieżki strony" powoduje wyświetlenie tabeli dotyczącej sposobu interakcji z daną publikacją. W tabeli dla publikacji z treścią powinny znajdować się dwa wiersze:
- /zip/ - oznacza pobranie publikacji jako archiwum ZIP
- /<nazwa pliku głównego> - oznacza wyświetlenie publikacji on-line
- Na kroku (3) powyżej można wprowadzić dodatkowe filtrowanie aby wyświetlić tylko pobrania. W tym celu należy:
- Dodać "Wymiar dodatkowy" (przycisk nad tabelą) o nazwie "Poziom 3 ścieżki strony"
- Włączyć zaawansowane filtrowanie wierszy tabeli (link "zaawansowane" po prawej stronie nad tabelą) i wybrać:
Popularność obiektów - liczba wyświetleń on-line i pobrań jako archiwum ZIP
- Wybrać raport: ZACHOWANIE / Analiza treści
- W tabeli, w kolumnie "Poziom 1 ścieżki strony" kliknąć /Content/
- Widoczna jest tabela z identyfikatorami publikacji, posortowana domyślnie wg liczby odsłon, malejąco. Odsłona to w tym kontekście liczba wyświetleń on-line i pobrań jako archiwum ZIP.
- Kliknięcie w identyfikator publikacji w kolumnie "Poziom 2 ścieżki strony" powoduje wyświetlenie tabeli dotyczącej sposobu interakcji z daną publikacją. W tabeli powinny znajdować się dwa wiersze:
- /zip/ - oznacza pobranie publikacji jako archiwum ZIP
- /<nazwa pliku głównego> - oznacza wyświetlenie publikacji on-line
- Na kroku (3) powyżej można wprowadzić dodatkowe filtrowanie aby wyświetlić tylko pobrania. W tym celu należy:
- Dodać "Wymiar dodatkowy" (przycisk nad tabelą) o nazwie "Poziom 3 ścieżki strony"
- Włączyć zaawansowane filtrowanie wierszy tabeli (link "zaawansowane" po prawej stronie nad tabelą) i wybrać:
Zainteresowanie obiektami - czas spędzany na stronach z treścią obiektów
The User Has Spent at Least Five Minutes in Total on a Page of the Digital Library during the Session
Goal settings as in the screenshot below.
Data Analysis Samples
Below, examples of data analysis concerning user traffic in a digital library are shown. Those examples are by no means exhaustive, but they have been selected with the view to highlighting selected GA possibilities which are interesting in the context of digital libraries.
Object Popularity – the Number of Metadata Page Impressions and of Online Impressions
- Select the “Behavior > Content analysis” report.
- In the table, in the “Level 1 of the page path” column, click the “/dlibra/” item.
- In the table, in the “Level 2 of the page path” column, click the “/publication/” item.
- The table with publication identifiers is visible; the default sorting order is by page views, in descending order. In this context, a page view is:
- for a publication with content – an impression of the metadata page or an impression of online content;
- for a publication without content (for example, higher-order elements of group publications, like a whole journal) – an impression of the page with the description/structure of an element of a group publication.
- When a publication identifier in the “Level 3 of the page path” column is clicked, the table about the way of interacting with the publication will be displayed. The table should contain two rows:
- /zip/ – for downloading the publication as a ZIP archive; and
- /<main file name> – for displaying the publication online.
- In step 3 above, additional filtering may be introduced to only display downloads. For that purpose, the user should:
- add “Additional dimension” (the button over the table) named “Level 3 of the page path”;
- enable advanced filtering of table rows (the “Advanced” link on the right, over the table) and select:
Object Popularity – the Number of Online Impressions and of Downloads in the Form of a ZIP Archive
- Select the “Behavior > Content analysis” report.
- In the table, in the “Level 1 of the page path” column, click the “/Content/” item.
- The table with publication identifiers is visible; the default sorting order is by page views, in descending order. In this context, a page view is the number of online impressions and of downloads in the form of a ZIP archive.
- When a publication identifier in the “Level 2 of the page path” column is clicked, the table about the way of interacting with the publication will be displayed. The table contains two rows:
- /zip/ – for downloading the publication as a ZIP archive; and
- /<main file name> – for displaying the publication online.
- In step 3 above, additional filtering may be introduced to only display downloads. For that purpose, the user should:
- add “Additional dimension” (the button over the table) named “Level 3 of the page path”;
- enable advanced filtering of table rows (the “Advanced” link on the right, over the table) and select:

Interest in Objects – the Time Spent on Object Content Pages
- Select the “Behavior > Events > The most frequent events” report.
- In the table with events, click the “reading” item (in the “Event category” column).
- In the table with events, click the “heartbeat” item (in the “Event action” column).
- In the “Event label” column, the table presents a list of identifiers of the editions the content of which the users have viewed the longest. Every label has the following structure: edition-<numerical identifier of the edition>-format-<numerical identifier of the format>, and the last element is only filled for multi-format objects.
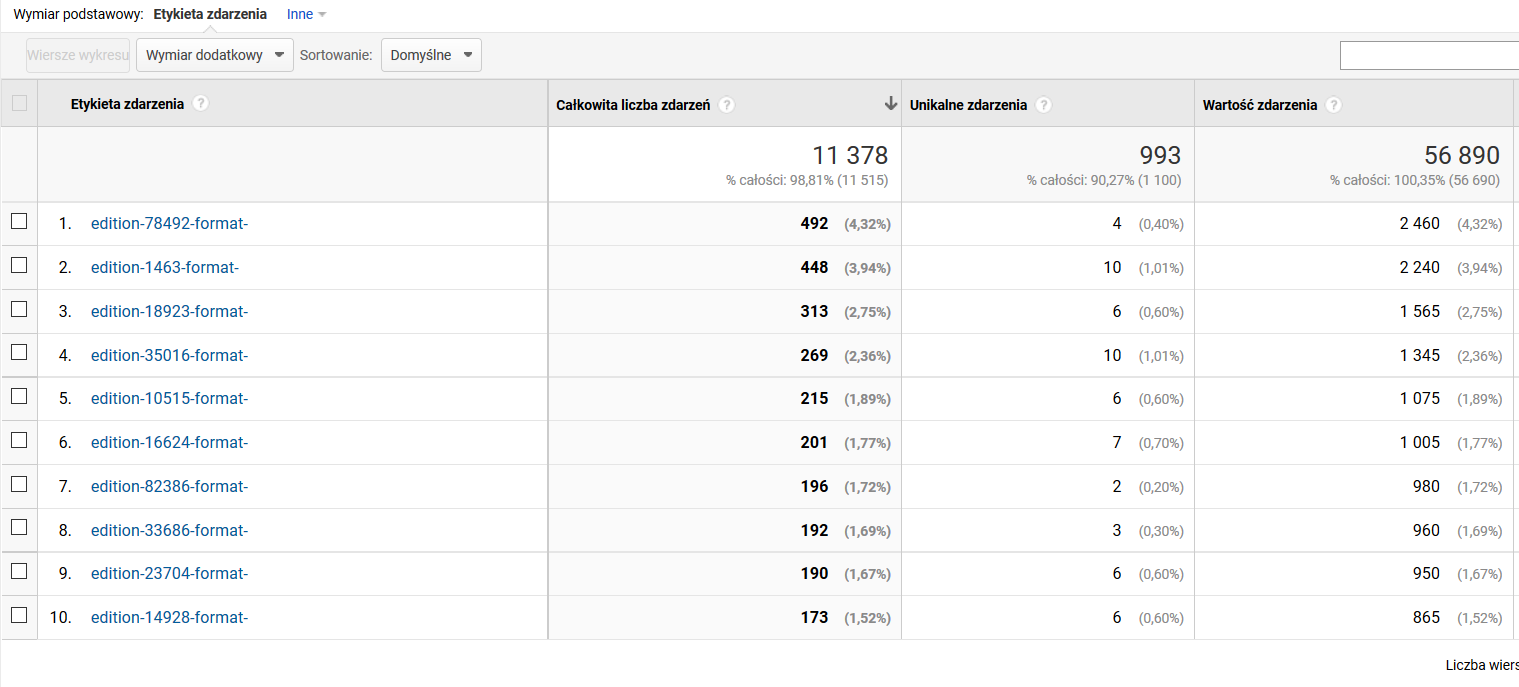
- The columns are interpreted in the following way:
- the total number of events – the total number of the five-minute intervals that users have spent viewing the content of the edition;
- unique events – the number of unique user sessions, in which a user has spent at least five minutes viewing the content of the edition; and
- event value – the total number of minutes that users have spent viewing the content of the edition.
- To facilitate data analysis, an additional dimension can be added to the table (the button just over the table). The suggested dimensions are:
- page – a column with the links to the objects will be added; and
- page title – a column with the titles of the objects will be added.
- Wybrać raport ZACHOWANIE / Zdarzenia / Najczęstsze zdarzenia.
- W tabeli ze zdarzeniami kliknąć w "reading" (w kolumnie Kategoria zdarzenia).
- W tabeli ze zdarzeniami kliknąć w "heartbeat" (w kolumnie Akcja zdarzenia).
- Widoczna tabela przedstawia w kolumnie "Etykieta zdarzenia" listę identyfikatorów wydań, przy treści których użytkownicy spędzili najwięcej czasu. Każda z etykiet ma następującą strukturę: edition-<numeryczny identyfikator wydania>-format-<numeryczny identyfikator formatu>, przy czym ostatni element jest wypełniany tylko w przypadku obiektów wieloformatowych.
- Interpretacja poszczególnych kolumn jest następująca:
- Całkowita liczba zdarzeń - łączna liczba pięciominutowych interwałów spędzonych przez użytkowników nad treścią danego wydania
- Unikalne zdarzenia - liczba unikalnych sesji użytkowników, w których użytkownik spędził nad treścią danego wydania przynajmniej pięć minut
- Wartość zdarzenia - łączna liczba minut spędzona przez użytkowników nad treścią danego wydania
- Dla ułatwienia analizy danych można dodać wymiar dodatkowy do tabeli (przycisk tuż nad tabelą). Sugerowane wymiary to:
- Strona - spowoduje dodanie kolumny z linkami do poszczególnych obiektów
- Tytuł strony - spowoduje dodanie kolumny z tytułami poszczególnych obiektów